LBI Real Estate Market Data: 5-Year Analysis (2020-2025)
We've analyzed over 1,700 transactions and 5+ years of LBI real estate data to understand market patterns and trends. Here's what the numbers reveal about our local market performance from 2020 through mid-2025.
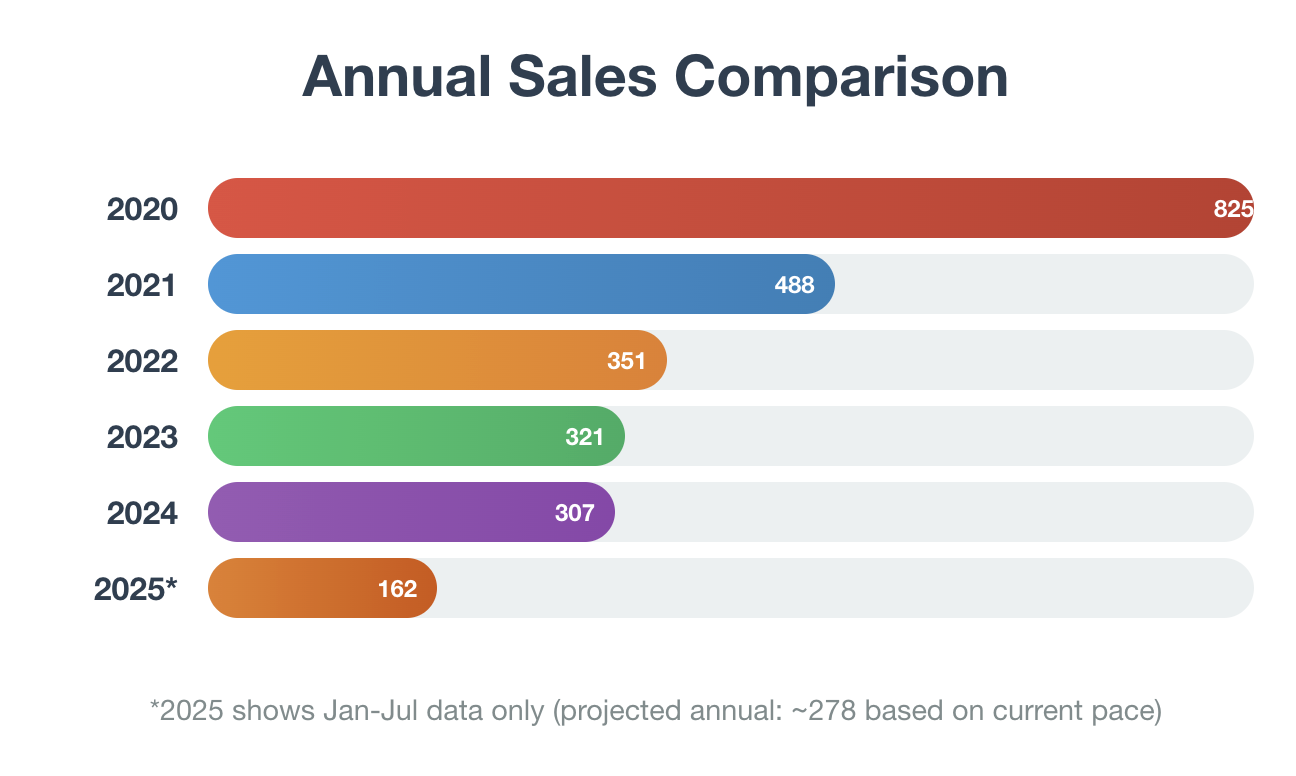
Annual Sales Summary
Total Sales by Year:
2020: 825 sales
2021: 488 sales
2022: 351 sales
2023: 321 sales
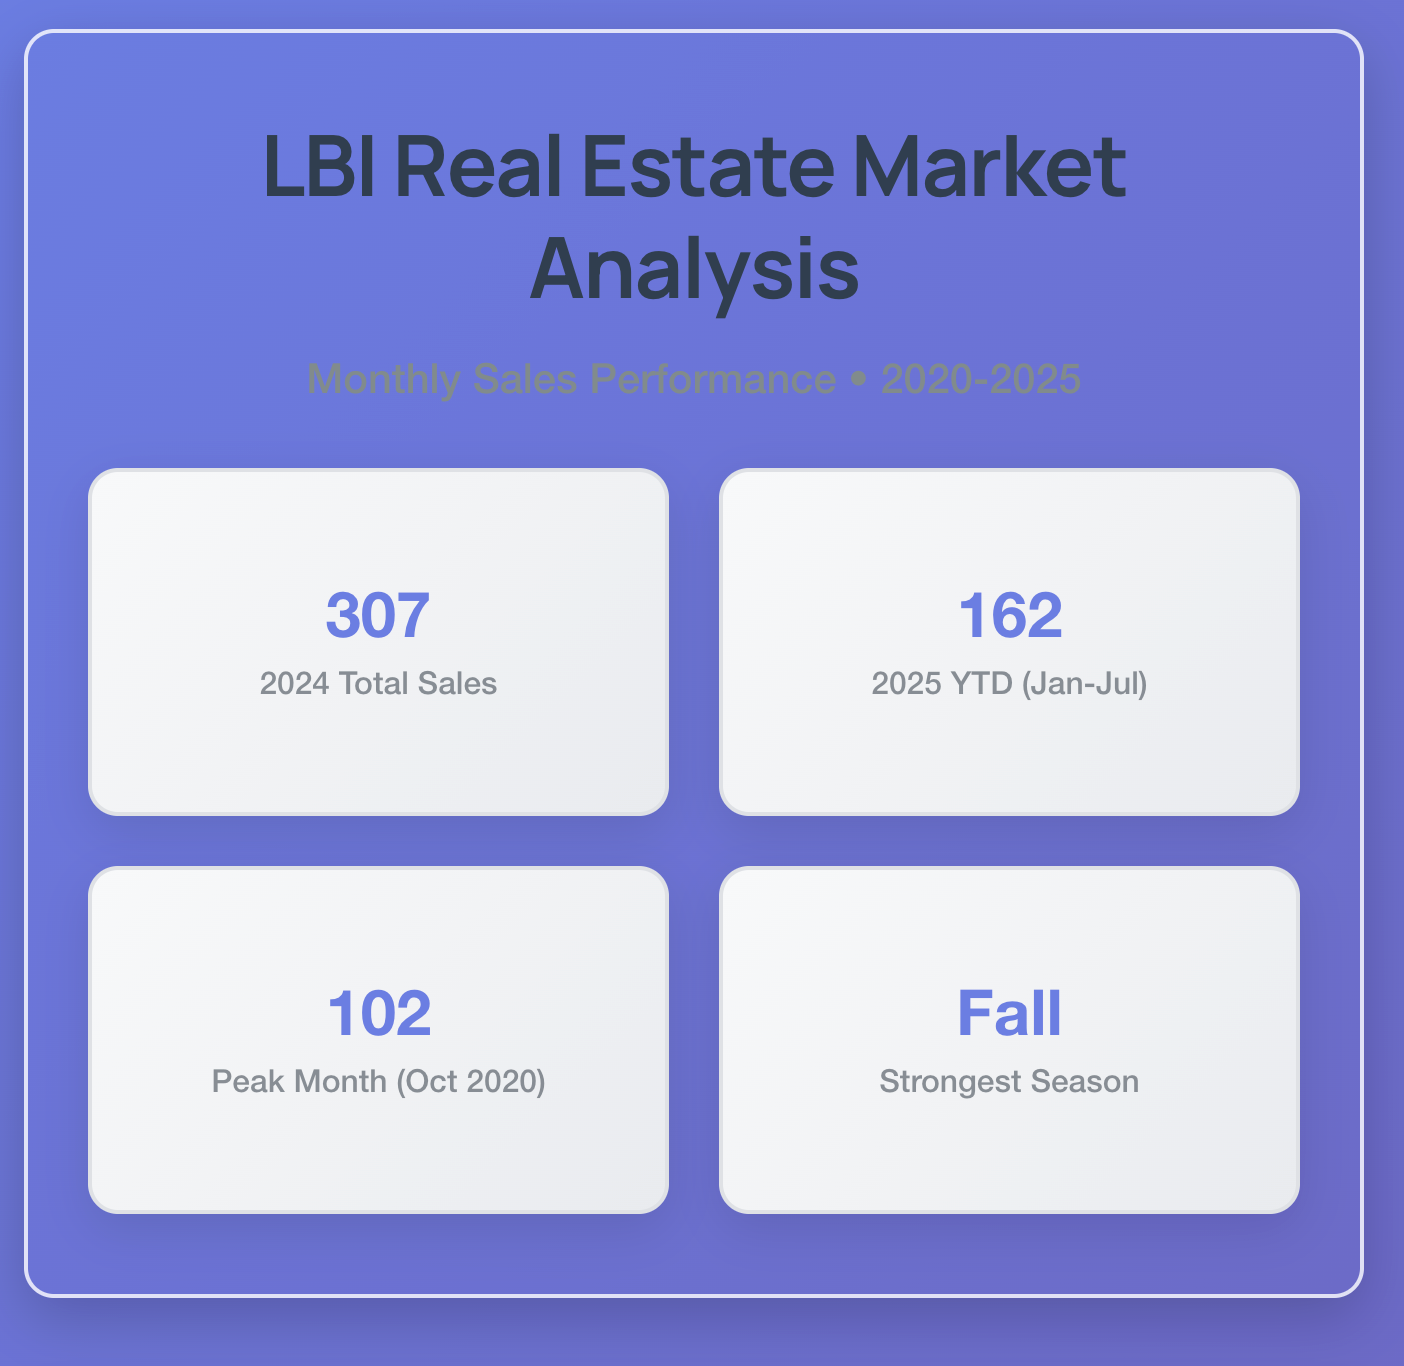
2024: 307 sales
2025: 162 sales (Jan-Jul, projecting ~280 annually)
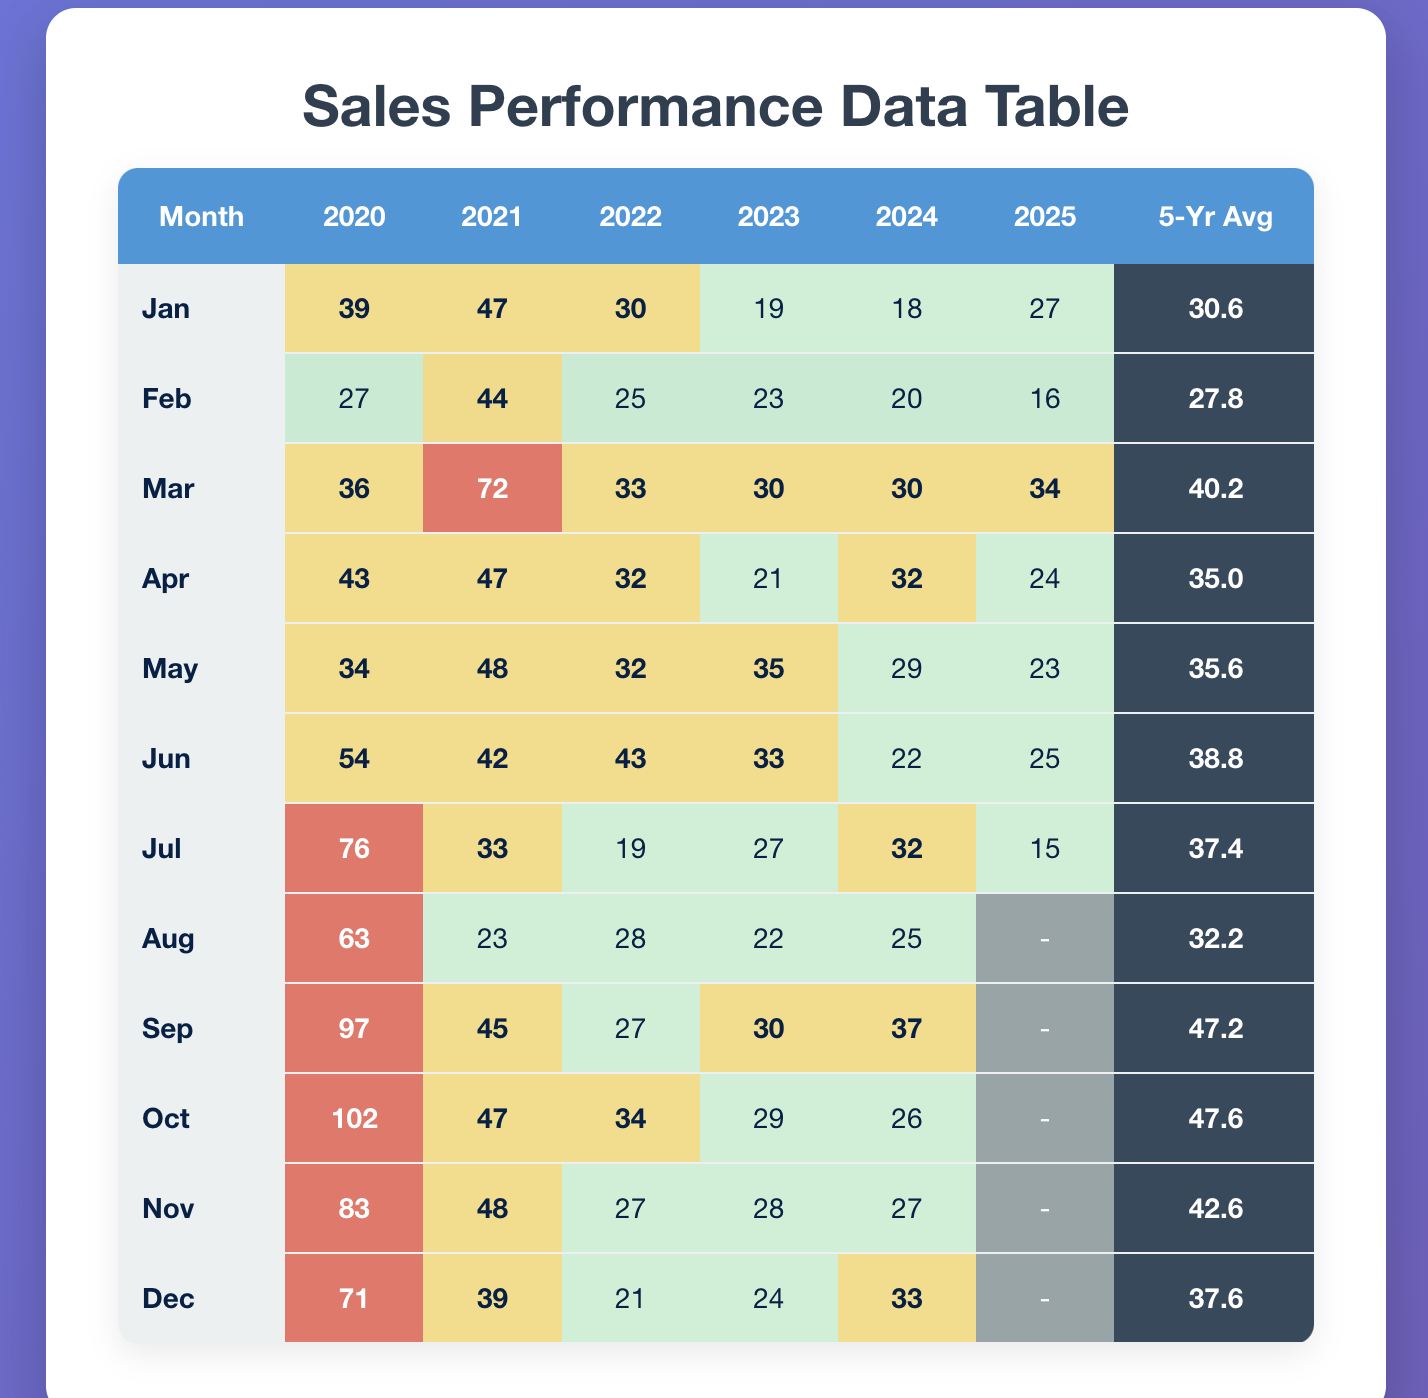
Monthly Patterns
Highest Activity Months (5-Year Average):
October: 47.6 sales
September: 47.2 sales
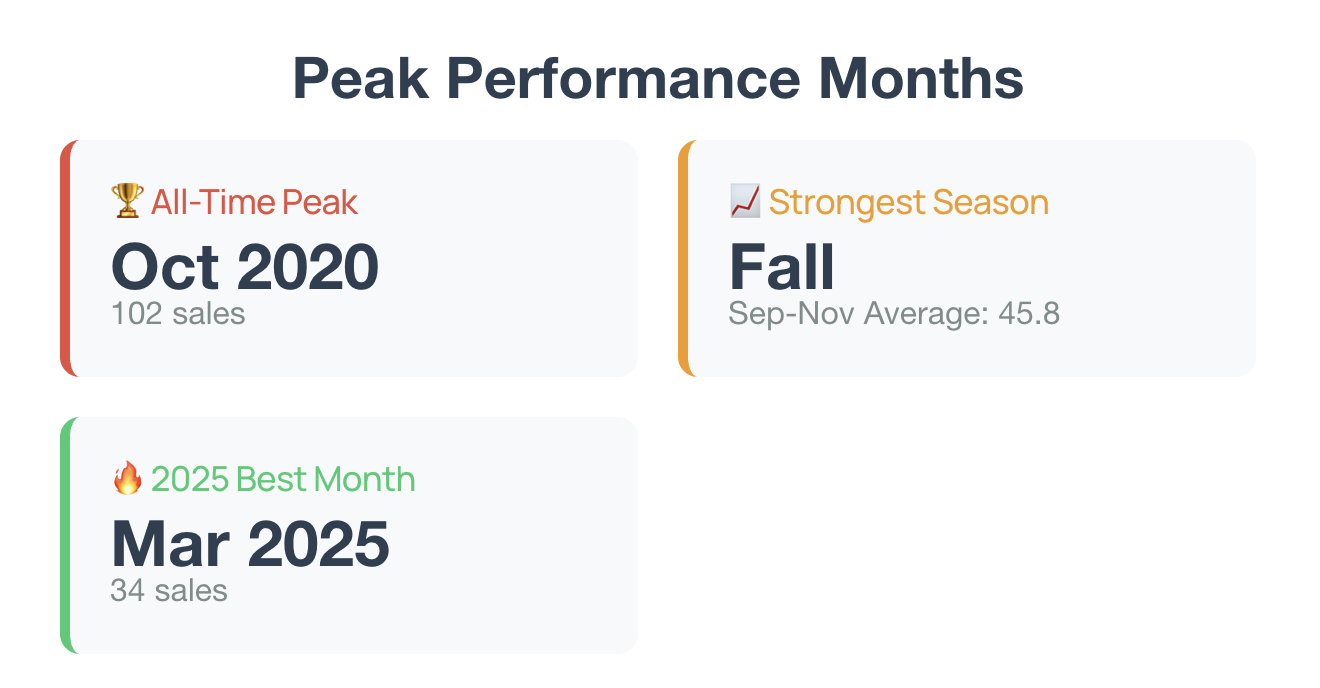
March: 40.2 sales
June: 38.8 sales
July: 37.4 sales
Moderate Activity Months:
December: 37.6 sales
May: 35.6 sales
April: 35.0 sales
August: 32.2 sales
Lower Activity Months:
January: 30.6 sales
February: 27.8 sales
Notable Market Characteristics
Seasonal Distribution
Fall (Sep-Nov): Consistently strong activity across all years
Spring (Mar-May): Steady, reliable performance
Summer (Jun-Aug): Variable activity with some volatility
Winter (Dec-Feb): Lower but consistent activity levels
Year-Over-Year Trends
2020: Exceptional performance across all seasons
2021: Elevated activity continuing from 2020 momentum
2022-2024: Market stabilization with consistent seasonal patterns
2025: Early indicators suggest continued stability
Market Insights
Peak Performance: October 2020 recorded our highest single-month total with 102 sales.
Market Evolution: The data shows a transition from the elevated activity of 2020-2021 to a more consistent market pattern in recent years.
Seasonal Reliability: While monthly totals vary, seasonal patterns have remained relatively consistent across the analysis period.
Current Trajectory: 2025 data through July suggests the market is maintaining its stabilized performance level established in 2022-2024.
Data Methodology
This analysis is based on comprehensive monthly sales data spanning January 2020 through July 2025, representing over 1,700 transactions. The data provides insights into both short-term seasonal patterns and longer-term market evolution on Long Beach Island.
This market analysis is provided to help buyers, sellers, and investors better understand LBI real estate patterns. For specific guidance on your real estate needs, consult with a qualified local professional who can apply these insights to your individual situation.