
Long Beach Island Bayfront & Lagoonfront Real Estate Market Update 2026
Waterfront Overview
The Long Beach Island waterfront market continued to show strength and resilience over the past 12 months, with median prices rising across both bayfront and lagoonfront segments despite a noticeable decline in the number of sales. From May 2025 - May 2026 a total of 31 waterfront sales closed island wide, down from 55 in the prior period, yet values pushed meaningfully higher. The story of the market continues to be one of tight supply.
Bayfront Market
Bayfront Summary
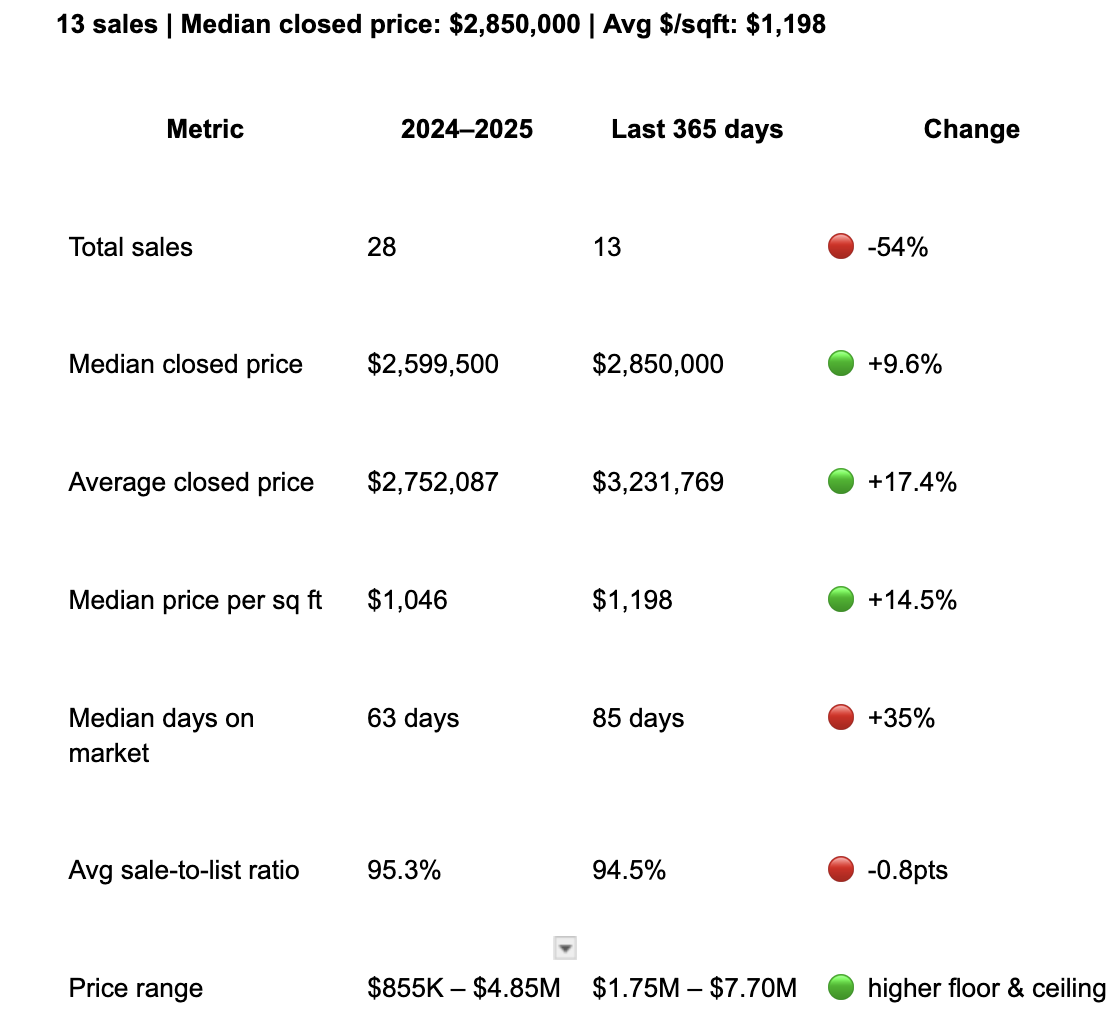
The bayfront segment saw significant price appreciation over the past year. The median sale price rose 9.6% and the median price per square foot jumped 14.5% from $1,046 to $1,198 reflecting genuine market appreciation rather than simply a shift in the mix of homes sold. There was confidence among high-end buyers with the most expensive sale coming in at $7,700,000 for a 6,300 square foot bayfront estate in Loveladies. This is up from $4,850,000 in the prior period.
With only 13 sales over the past 12 months compared to 28 in the prior period, inventory remains extremely constrained. Buyers who want bayfront have fewer options than at any point in recent memory, and that scarcity is a primary driver of continued appreciation.
Bayfront — Age of Homes Sold
The bayfront homes that sold over the past twelve months ranged from a 1938 cottage in Harvey Cedars to a 2016 custom build in Long Beach Township, a span of nearly 90 years of construction. The median property age was 43 years, virtually unchanged from 41 years in the prior period, suggesting the composition of what sells on the bay has remained consistent. The majority of transactions involved homes built between the 1950s and 1990s, with only two properties from the 2000s or newer changing hands. This is notable because it confirms that bayfront value is driven overwhelmingly by land and location rather than the age or condition of the structure. A dynamic that benefits every bayfront owner regardless of when their home was built.
Bayfront — Days on Market
One nuance worth noting is that the median days on market increased from 63 to 85 days, and the average sale-to-list price ratio dipped very slightly to 94.5%. Bayfront buyers are deliberate and well-informed. Proper pricing from day one remains essential. Overpriced bayfront homes do sit, while well-priced properties continue to attract serious buyers.
Lagoonfront Market
18 sales | Median closed price: $2,515,000 | Avg $/sqft: $1,093
Lagoonfront Overview
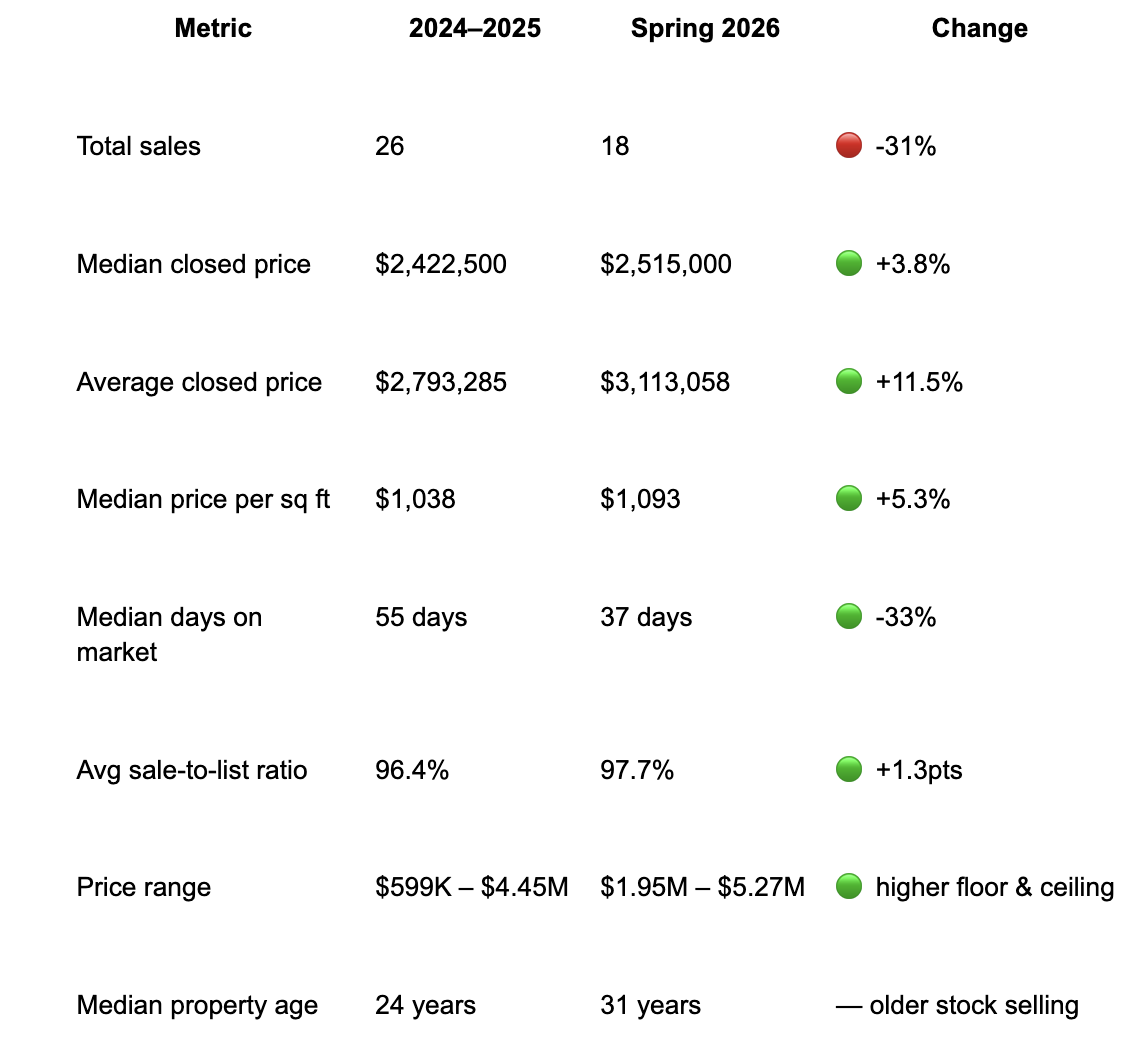
The lagoonfront segment told a compelling story, one of speed, competition, and rising values. Median days on market dropped sharply from 55 to just 37 days, and sellers averaged 97.7% of their asking price, up from 96.4% in the prior period. Several homes sold at or above list price, a clear indicator of multiple offer activity and motivated buyers willing to move quickly on well-positioned properties.
Median prices rose 3.8% year over year, a more modest gain than bayfront but meaningful given the small number of transactions. The average sale price tells another story, up 11.5% to $3,113,058. This can be explained by the lack of transactions and a cluster of luxury transactions pulling the average up significantly. Four of the 18 sales, more than 20% of the dataset, closed above $4.3M.
337 Cranberry Drive: $4,750,000
18 Panorama: $4,650,000
131 Laguna Ln: $4,350,000
516 Leeward Ave: $5,265,000
In the prior period, the highest lagoonfront sale was $4,450,000 and there were fewer transactions in that upper range, so the average and median stayed closer together.
Lagoonfront — Age of Homes Sold
The lagoonfront segment saw a meaningful shift in the age of homes sold compared to the prior period. The median property age rose from 24 years to 31 years, meaning older homes made up a larger share of transactions this past year. The homes that sold ranged from a brand new 2025 construction in Long Beach Township to a 1960 vintage home on Arnold Boulevard, with a healthy mix of 1960s, 1970s, 1980s, and 1990s stock in between. Notably, eight of the eighteen sales involved homes built in the 2020s, so new construction remained active at the top of the market. The fact that prices appreciated even as the overall mix skewed older is a strong indicator of underlying demand, so lagoonfront buyers are not waiting for new construction. Well-maintained homes of any era, priced correctly for their location, are finding motivated buyers quickly.
Bayfront vs. Lagoonfront: Key Differences
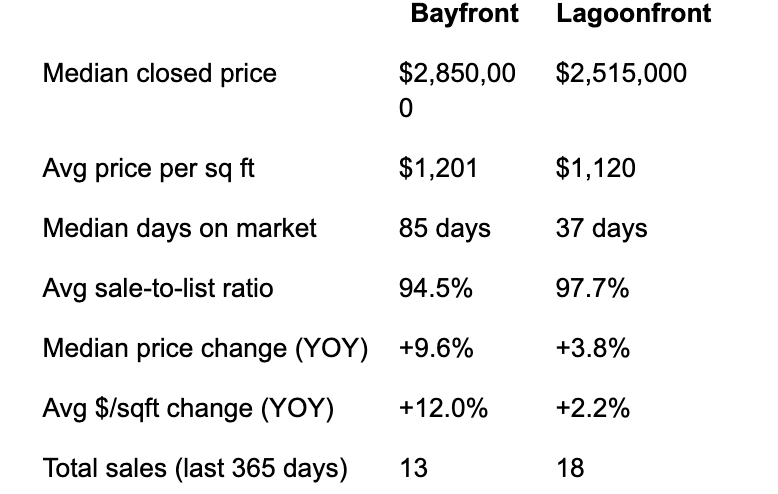
Bayfront properties command a premium of approximately $335,000 at the median and $81 per square foot over lagoonfront, reflecting the unobstructed water views, direct water frontage, and prestige associated with the bayfront location. Lagoonfront homes, however, offer a more liquid market: they have been selling faster, closer to asking price, and with less negotiation friction. Both segments are appreciating and are undersupplied.
What this means for waterfront homeowners
Whether you own on the bay or on a lagoon, the fundamental dynamic is the same: there are more qualified buyers than there are waterfront homes available. That imbalance has supported prices even after the lifetime of appreciation we saw through COVID.
For owners who have considered selling, this market rewards preparation and proper positioning. Homes that are priced accurately and presented well are finding buyers quickly and at strong values. Homes that are overpriced relative to comparable sales are sitting longer and ultimately selling for less.
If you would like to know what your specific property is worth in today’s market, or if you have questions about anything contained in this report, reach out to us. We are always happy to provide a complimentary, no-obligation market evaluation.