Long Beach Island Real Estate Market Recap - October, 2025
By: Matt Cappo LBI Real Estate Agent | The Van Dyk Group 📱 Cell: 609-496-1423
As October comes to a close, let’s take a look at how this month compared to the rest of the fall market. We’ll focus on single-family home sales, as they are the most common property type on the island and provide the best insight into overall market trends.
Long Beach Island experienced a healthy level of activity in the real estate market this month. Thirty-five new properties were listed for sale, and thirty-three homes sold. On average, homes spent 51 days on the market, with an average sale price of $2,447,826 across the island.
As the fall market winds down, new inventory has been decreasing, but demand across all price segments remains strong. Homes sold, on average, 20 days faster than in September. In October, single-family home listings ranged from $999,000 to $12,500,000 — a wide range that reflects seller confidence in both the entry-level and luxury markets.
Average sale price:
August: $2,584,268
September: $2,237,463
October: $2,447,826
The average sale price ticked up to $2.4M as there were 2 oceanfront sales, several oceanblock, and new construction sales increasing the month over month avg sale price.
Active listings:
August: 201
September: 159
October: 116
Buyers acted quickly on properties in September and there were a considerable amount of closings over the last two months. Combine this with the fact that many sellers target August and September, and you are bound to see less total listings in October.
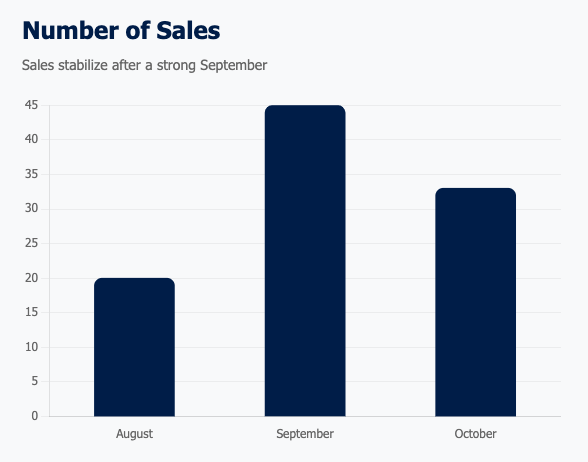
Number of sales:
August: 20
September: 45
October: 33
There is a healthy amount of sales compared to the summer months where we saw roughly 16 sales a month. The fall spike in new listings continues to get absorbed and this number likely decreases over the next few months.
Average days on market
August: 101
September: 65
October: 51
Properties moved fast this month not only because of buyer demand but because the sale price to list price ratio was over 99%. Properties that hit the market in September were priced correctly and closed in October therefore representing a much lower avg days on market compared to the last two months.
Market Summary
The LBI real estate market continues to demonstrate remarkable strength heading into the winter season. With average sale prices stabilizing in the mid-$2M range and properties selling at nearly 100% of list price, buyer confidence remains robust. The most striking trend is the dramatic decrease in days on market, dropping from 101 days in August to just 51 days in October, signaling urgent buyer demand even as we enter the typically slower season.
Active inventory has tightened considerably, falling to just 121 listings in October, which has created a competitive environment for motivated buyers. Following September's strong performance of 45 sales, the market has stabilized with 33 transactions in October, reflecting healthy, sustained activity despite limited inventory.
The Bottom Line: This is a seller's market characterized by low inventory, quick sales, and strong pricing. Well-priced, quality properties in desirable locations are moving faster than ever.
Ready to Make Your Move?
Whether you're considering selling your LBI property or looking to buy, as your local market expert, I can help you navigate these conditions to achieve your real estate goals. Let's discuss your strategy for success in today's LBI market.
Contact me today for a complimentary market analysis or buyer consultation.


