
Long Beach Island September real estate market recap

Long Beach Island (LBI) September real estate market recap
The LBI real estate market saw significant activity throughout September! While there were less total listings in September compared to August this is common due to September being a common time to close on a property. There was a healthy mix of new listings, properties under contract, pending, and closed sales. There is enough data recorded within a month to give a good snapshot of the direction the market is headed and how it has evolved over the last few months. Whether you’re tracking the strength of the market, pricing or inventory trends, or just want to stay updated on everything LBI these updates offer valuable insights into dynamics we are seeing in the Long Beach Island real estate market.
By: Matt Cappo LBI Real Estate Agent | The Van Dyk Group 📱 Cell: 609-496-1423 ☎️ Office: 609-492-1511
✉️ mcappo@vandykgroup.com 🌐 www.LBILiving.com
Key stats

Average sale price:
July: $2,142,443
August: $2,584,268
September: $2,237,463
There have been a considerable amount of transactions in the low $2M’s over the summer and into the fall signaling strong demand for properties in good condition and well located.
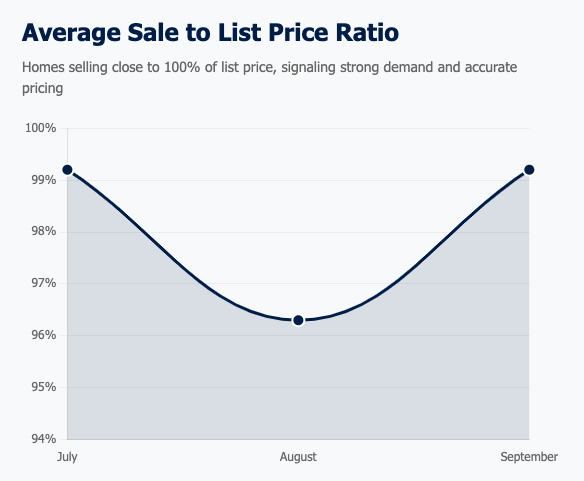
Average sale to list price ratio:
July: 99.20%
August: 96.30%
September: 99.2%
Homes are selling close to 100% of the list price signaling strong buyer demand in the fall market as well as accurate pricing from sellers the past few months.
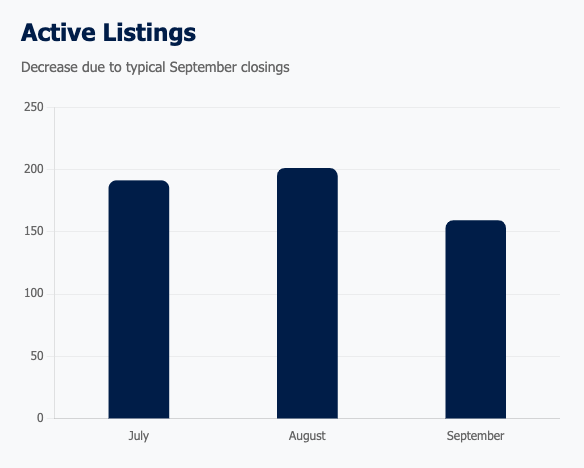
Number of active listings
July: 191
August: 201
September: 159
Number of listings decreased due to a typical increase in September closings.

Number of new listings
July: 49
August: 59
September: 47

Number of sales
July: 26
August: 20
September: 45
An increase in September sales is typical as buyers who did not want to acquire a property as a rental decided to close in the fall and let the seller collect the rental income and manage the tenants.
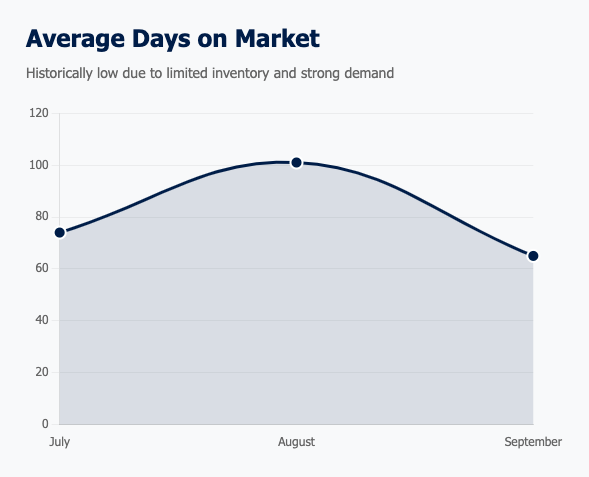
Average days on market
July: 74
August: 101
September: 65
Days on market remains historically low due to low inventory and strong demand.
Long Beach Island real estate market insights and trends
Long Beach Island saw significant activity this month with 45 home sales, and properties spent an average of 65 days on the market. The sale-to-list price ratio shows that buyer demand remains strong this fall. We also noticed last month that sellers were pricing their homes to sell, which led to quick offers at asking price. This seasonal momentum will keep sellers motivated and lead to more new activity, as we saw in late September. While the market remains competitive and well located properties get consumed quickly, buyers have the opportunity to capitalize on well priced listings ahead of the typical post fall slowdown.
For more updates on market activity or Long Beach Island in general, feel free to give me a call!